What are the strengths of my course? What could I do to provide my students with better support with their learning processes? A qualitative evaluation of courses using TAP provides answers to these questions and thereby offers insight into students’ learning processes. A good foundation for continuing to develop courses in a way that is data-based.
Measuring teaching: A critical appraisal
Meanwhile, the evaluation of courses has become a set component of quality assurance when it comes to teaching at universities. Generally, the students are asked to rate the course with the help of standardised questionnaires at the end of a semester. There is no doubt that this approach is viable as it can be used to evaluate a multitude of courses with any number of participants very quickly. However, several shortcomings have come under criticism for a while now:

When it comes to teaching there is no such thing as one size fits all: courses are very heterogeneous with regard to the composition of their students, how the courses are held and what the targets are. Accordingly, evaluation criteria (as characteristics of successful didactic action) can only be determined based on the specific context (Renkl, 2015). In a typical lecture, for example, the clear, structured presentation of content is a core quality characteristic. In a seminar in the humanities, on the other hand, it is more important for students to be encouraged to question content critically and discuss it through skilful facilitation. Again, when students are doing tasks in statistics, for example, it is individual feedback that is key. However, an analysis of various evaluation sheets from German universities showed that individual learning conditions are hardly included in the standardised questionnaires at all (Barzon & Jahnke, 2010).
What is also problematic is that it is scarcely possible for lecturers to get tips from the feedback that could improve their teaching. An item like “the lecturer can make complicated material easy to understand” measures the extent to which the communication worked, of course, but if a rating is critical, it is generally difficult for teachers to deduce concrete suggestions for how to actually make it easier for students to understand them (Barzon & Jahnke, 2010). Should I use more examples? Is the approach I use too fast? Is it that there’s no main thread? Or do the students not have the previous knowledge they need? Questions like these cannot be answered based on the quantitative feedback alone.
It is therefore helpful to supplement a quantitative evaluation with qualitative methods, as while quantitative surveys chiefly deliver numerical data (e.g. an average), qualitative methods enable a more interpretative analysis due to the open-ended questions posed. Therefore, the Centre for University and Academic Teaching (ZHW) at the University of Regensburg has already been offering a Teaching Analysis Poll for over 10 years as a supplement to the usual surveys using questionnaires.
Discuss strengths and weaknesses in small groups
Teaching Analysis Polls (TAPs) are usually carried out in the middle of a semester and follow a simple procedure: in a facilitated group discussion, students discuss what helps their learning process in a course and what they experience as a hindrance. The feedback is analysed by a higher education didactics moderator and organised according to didactic aspects. In a final consultation, lecturers work together with a university didactic counsellor to work out options for developing their course further. This is how a TAP works at the University of Regensburg:
Analysing feedback didactically
The methodology of the Teaching Analysis Poll outlined above features several fundamental methodological advantages over other evaluation approaches (Hawelka & Hiltmann, 2018). What is essential here from a pedagogical standpoint is the didactic analysis of the student feedback.
As the video shows, the students write down their results in bullet point form. In a plenary session, the points mentioned are paraphrased and mirrored again by the moderator. Here, ambiguous statements that could be misunderstood are clarified and interpreted didactically. This procedure can be illustrated by the statement “ONLY presentations”, for example. At first, this statement can be interpreted in different ways: (1) the students might find the routine of the sessions monotonous as only student presentations are used as a didactic method; (2) or they feel the lack of input from the teacher and rate the input from their fellow students as being too extensive.
In this example, after the moderator enquired it became clear that the students felt that the fact that the lecturer provided too little input hindered their learning process. In this example, the original feedback of “ONLY presentations” was paraphrased by “too little input from lecturer”.
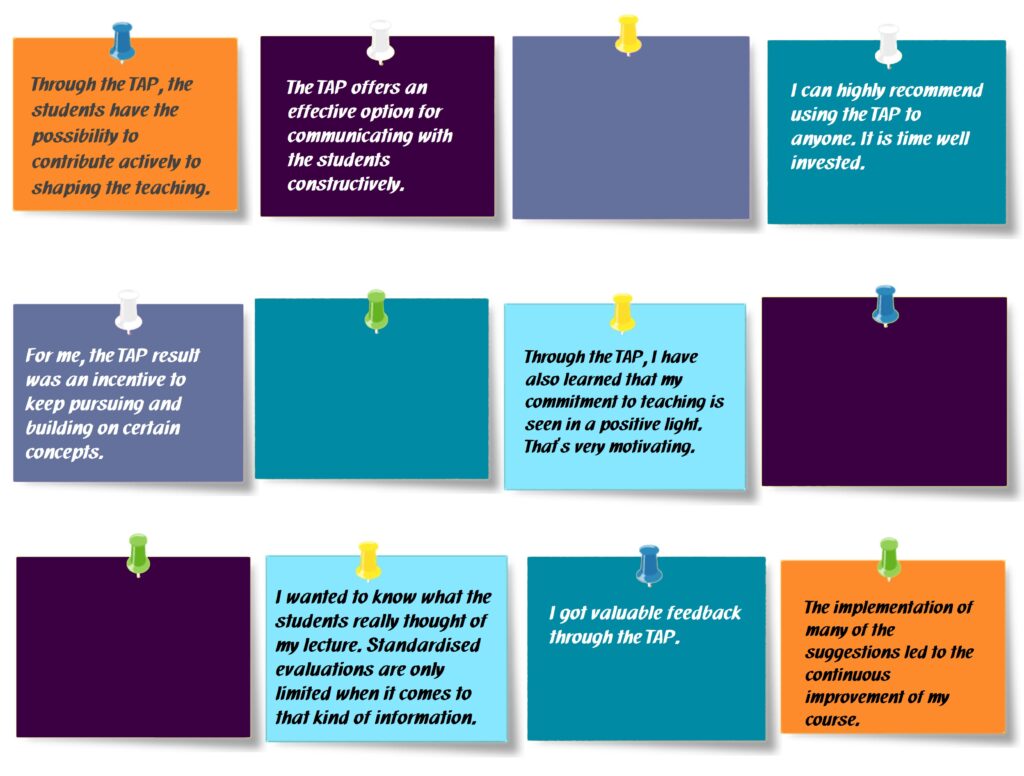
The paraphrased answers are organised according to didactic criteria and interpreted in the context of the intended learning outcomes with the help of coding guidelines (Hawelka, 2017). The teachers receive structured feedback as the result (see Fig. 1)
Developing courses constructively
This feedback serves as the basis for a consultation session about possible changes and improvements to the course. The evaluation is therefore the basis for a data-based teaching consultation. There is plenty of empirical evidence for the effectiveness of this combination of evaluation and consultation (Penny & Coe, 2004). The personal experience of teachers at the University of Regensburg also makes it clear that not only can strengths and weaknesses of a course be revealed with the help of a TAP but helpful approaches for the further course development can also be developed directly. Figure 1 shows how teachers at the University of Regensburg assess the benefit of the methodology.
Teachers at the University of Regensburg can register for a TAP at the middle of every semester using the ZHW website. In addition, we are happy to share experiences and procedures with regard to the TAP, of course. You are also welcome to use our comment function for that purpose.
References
Burzan, N. & Jahnke, I. (2010). Was misst die studentische Lehrkritik? Eine empirische Infragestellung von Lehrevaluationen an Hochschulen. Soziologie, 39(4), 438-461.
Hawelka, B. (2019). Coding Manual for Teaching Analysis Polls. Zentrum für Hochschul- und Wissenschaftsdidaktik, Regensburg.
Hawelka, B. & Hiltmann, S. (2018). Teaching Analysis Poll – ein Kodierleitfaden zur Analyse qualitativer Evaluationsdaten. In M. Schmohr & K. Müller (Hrsg.), Gelingende Lehre: erkennen, entwickeln, etablieren (S. 73-92). Bielefeld: Bertelsmann.
Penny, A. & Coe, R. (2004). Effectiveness of Consultation on Student Ratings Feedback: A Meta-Analysis. Review of Educational Research, 74(2), 215–253.
Renkl, A. (2015). Drei Dogmen guten Lernens und Lehrens: Warum Sie falsch sind. Psychologische Rundschau, 66(4), 211-220.
Suggestion for citation of this blog post
Hawelka, B. (2021, November 18). Teaching Analysis Poll (TAP) – More than just qualitative evaluation. Lehrblick – ZHW Uni Regensburg. https://doi.org/10.5283/zhw/20211118.EN

Birgit Hawelka
Dr. Birgit Hawelka is a research associate at the center for University and Academic Teaching at the University of Regensburg. Her research and teaching focuses on the topics of teaching quality and evaluation. She is also curious about all developments and findings in the field of university teaching.